
Scotland has embarked on an ambitious mission to tackle the two zeros (Vision and Net Zero) challenge. On one hand, Authorities are faced with the pressure of delivering projects aimed at increasing sustainable travel while reducing KSIs on the roads. On the other hand, budgets have always been limited, with the national active travel budget for 2024 tracking below the promised 10% of the total transport budget. This means that local authorities, for whom value for money is absolutely crucial, need all the help they can get to boost their schemes for maximum impact. Another talented team from VivaCity joined us at TRANSPORT Smart Class, Scotland 2024 to provide some of the answers.
Ana Luiza Kooij’s presentation explored how active travel can be significantly boosted by AI and computer vision technologies, in order to harness and maximise high quality transport data. Safer roads are essential to encourage more people to walk, cycle and wheel, and pave the way for the modal shift required. By leveraging the same AI-powered tools using near miss data, Ana explained how it’s possible to discover incident hotspots and zoom in to specific conflict areas, to proactively identify incidents before they happen. Compelling case studies were shared to showcase how authorities are using this high quality transport data to boost their schemes, to build evidence and prove success, and to secure bigger funding pots.
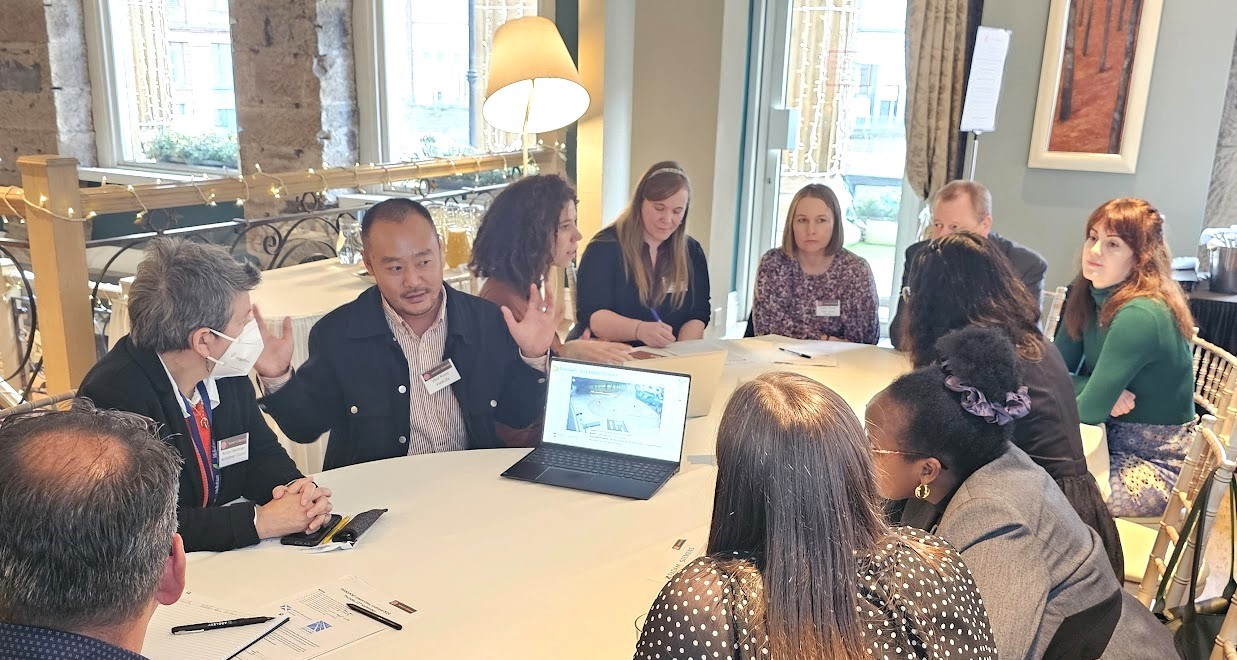
Following the presentations and Q&As, Ana (UK Business Development Manager) teamed up with Vitor Kono (VivaCity’s UK & Ireland Marketing Manager) to host deeper dive roundtable discussions with our delegates.
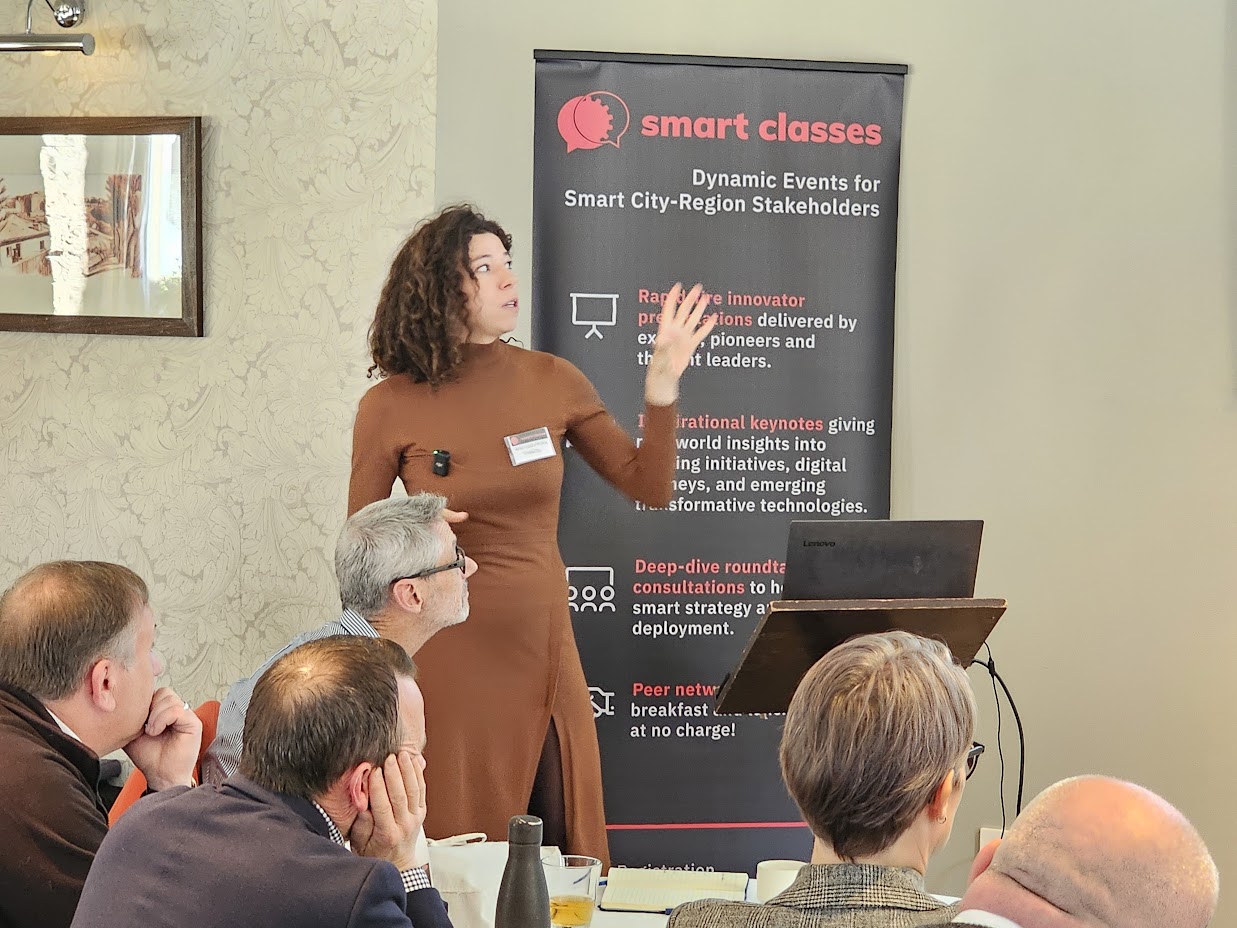
Presentation highlights:
- The Active Travel and Road Safety challenges and landscape in Scotland…
- Infographic – % of journeys <2 miles by walking mode from 2012 (48.5%) to 2022 (46.2%); % of journeys <2 miles by cycling mode from 2012 (1.5%) to 2022 (2.1%);
- The National Active Travel Framework (2014’s) vision for 2030 – Where “Scotland’s communities are shaped around people, with walking or cycling the most popular choice for shorter everyday journeys”;
- Infographic – Baseline for 2014-18 road safety; Fatalities from 2016-2023; Rate of reduction required from 2016-2030 to achieve -50% target;
- Transport Scotland’s National Strategy for 20 mph Speed Limits states that “The Programme for Government commits the Scottish Government to having 20mph limits on appropriate roads by the end of 2025”;
- English Road Safety challenges & landscape – Infographics of KSI (Adjusted Rates) 2012-2022 and All Road User Casualties (Per Bn Vehicles) 2015-2040 (to reach vision zero and current rate);
- Reported road casualty rates per billion vehicle miles by severity in Great Britain, 2012-2022 (source: gov.uk) – In 2022…5 fatalities, 91 KSI casualties and 413 casualties of all severities;
- Quantifying the Challenge – Stats19 data includes deaths, serious injuries and minor injuries but the true picture is akin to an iceberg with multiple times more “Near Miss” events (captured by VivaCity) beneath the surface;
- With 5,500+ sensors deployed and 30+ billion unique counts, VivaCity is working with 130 authorities across 10 countries to help cities overcome their biggest transport challenges. Their 3-in-1 solution for Smart Road Safety and Smart Signal Control includes: Real-time data visualisation via the dashboard with API integration options; Summary metrics and trend analysis; Short- and long-term data with intervention analysis;
- Vision Zero and/or Net Zero related challenges that VivaCity can help cities to overcome – Road Safety Fund; Safe Systems Approach; Road Safety Audits; 20mph Speed Limits; School Streets; Traffic Signal Data; Transportation Equity; Bus Service Improvement; Active Travel Initiatives; Behaviour Change; Micro Mobility Policies including E-Scooters; Smart City Initiatives; Healthy Streets;

- Liverpool City Region Case Studies…
- LCR includes Liverpool, Sefton, Knowsley, St Helens, Halton and Wirral. With a population of 01.6 million people and a workforce of 650,000, 85% of journeys are within the LCR, two thirds less than 5km and 50% of these are driven. LCR has a strong cultural identity and there are also socio-economic and health challenges associated with high levels of deprivation and lack of activity. Active travel is key to supporting the region;
- How important is Active Travel for LCR?
- Residents want to walk, wheel and cycle – 51% want to walk more; 43% want to cycle more; 2/3 support Active Travel and public transport investment increase; 55% support school streets; 1/3 use a car (they feel they have no choice); 57% support more protected cycle paths; 61% are in favour of more space for socialising, wheeling and cycling on their high street;
- The impact goes beyond cycling and walking – 3,708 serious long-term health conditions prevented; 60,000 tonnes of greenhouse case emissions saved; £1.03B delivered in economic benefits;
- A positive start – 44% of streets now have 20mph speed limits in the region; 18% of households are now within 125 metres of a cycle route; 340,000 cars taken off the roads daily, replaced by walking, wheeling and cycling;
- Childwall – City LCWIP Corridor – A bi-directional segregated cycle lane for a daily average of 1,000 cyclists; Proposed scheme – An 8km active travel corridor from Childwall through Wavertree and into the city centre; Infographics – 1) June 2022-June 2023 Cyclist Counts over time 2) Cyclist Tracks Data from 13 Sep 2023;
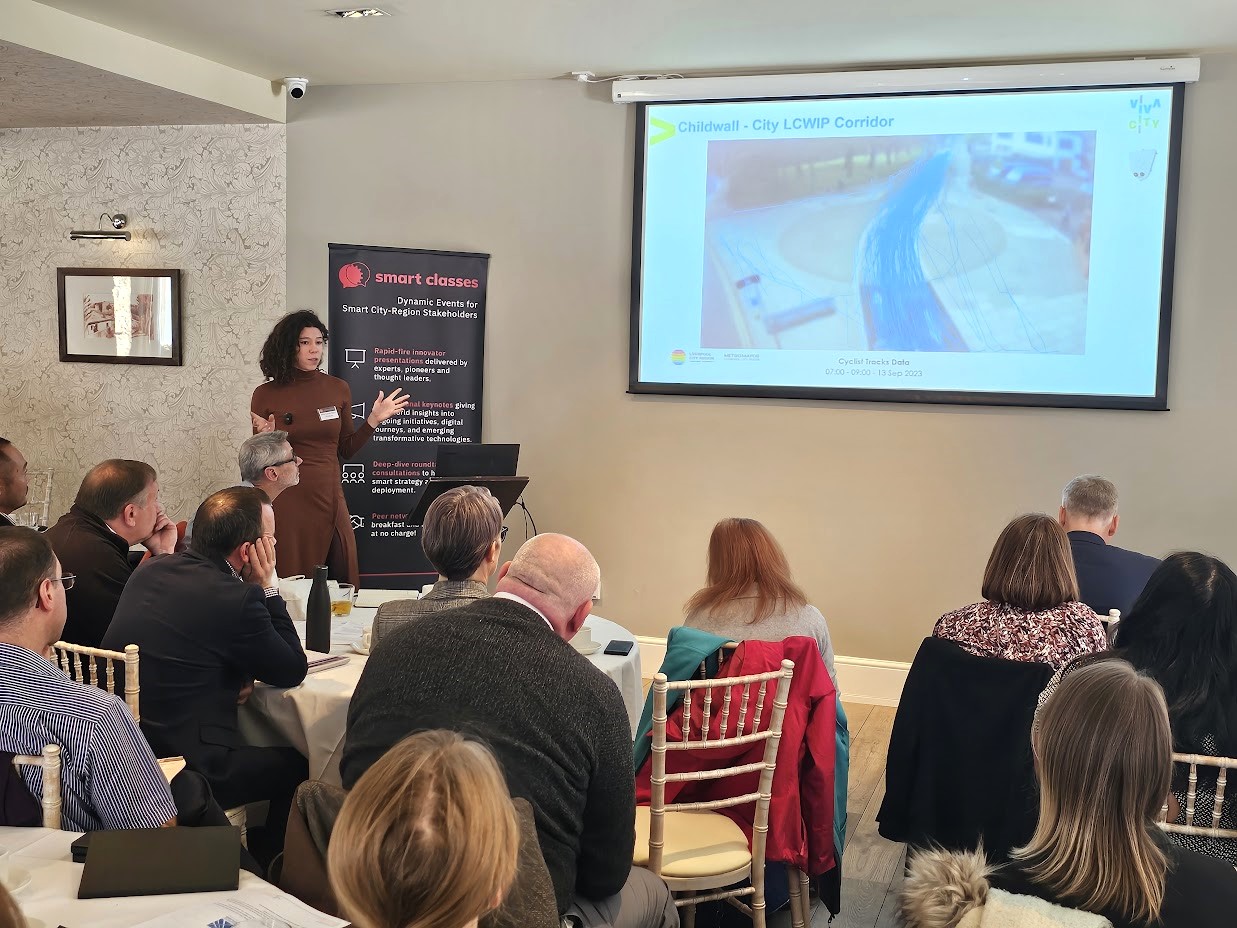
- Catharine St – Site and Scheme Context – Currently a 4 lane city centre road link carrying a daily average of 7500-8500 vehicles, 650 buses and 350-450 cyclists; Proposed scheme – 2 lanes of traffic removed in both directions for segregated cycle lanes;
- Catharine St Road Safety Insights – Near miss rate per cyclist, broken down by hour of the day; Road Safety video;
- Catharine St Complementary Safety Datasets – Snapshot of cyclist tracks travelling along Catharine St; Mean and 85th percentile spot speeds along Catharine St, broken down by vehicle classification (Motorbike, Car, LGV, OGV2, OGV2, Bus); 95th percentile dwell time of buses in the stop, giving an indication of the longest stopping times;
- Catharine St Journey Times – Journey time sensor placement along Catharine St; 75th percentile journey times (northbound flow) for both car and bus classifications;
- Evidencing Modal Shift in Wirral – Business As Normal – Bi-directional dual carriageway (A553) carrying daily average 12,000 vehicles, 200 buses and 100 cyclists; Proposed scheme – 2 lanes of traffic removed in both directions for segregated cycle lanes;
- Evidencing Modal Shift in Wirral – Road Space Reallocation – Average daily Pedestrian and Cyclist counts, before vs after; Percentage change in daily counts per day of the week, before vs after;
- Data Strategy Frameworks…
- Evidence Base for Active Travel delivery across your Network – 1) Data Gathering – Capture data at key locations in your network where you will build infrastructure and where you won’t 2) Evidence Impact – Show the impact on Active Travel on developed vs. no infrastructure 3) Quantitative Impact – Have some hero stats that you put in business cases;
- Evidence Base for Active Travel delivery through Scheme Monitoring – 1) Identify Scheme – Identify the schemes you know you’ll be delivering 2) Data Collection Plan – Plan for adequate data collection 12 months ahead of delivery 3) Data Analysis Milestones – Set out key milestones for data analysis in the project e.g. delivery, first 3 months, first year 4) Use Data Templates – Utilise existing templates for pre-post data analysis
If you meet our regular delegate qualification criteria but were unable to join us at Citation, Glasgow, for the live in-person event on September 12th, CLICK HERE and complete the short “Download form” (located at the bottom of the post) to receive a unique link enabling free access to the presentation video recordings and slides (including the film footage and slides from Ana’s initial presentation).

Those qualifying to receive the rich presentation content from this event include commissioning, procurement, trialling, partnering and policy leads, senior influencers, strategic decision makers, programme managers and planners from local authorities (e.g. city, borough, metropolitan, district and county councils); public transport operators; regional transport partnerships, sub-regional transport bodies, combined authorities, integrated transport authorities and passenger transport executives; highways authorities and road operators; government and supporting national transport agencies; non-governmental organisations; fleet operators, parking operators, prime contractors etc.


