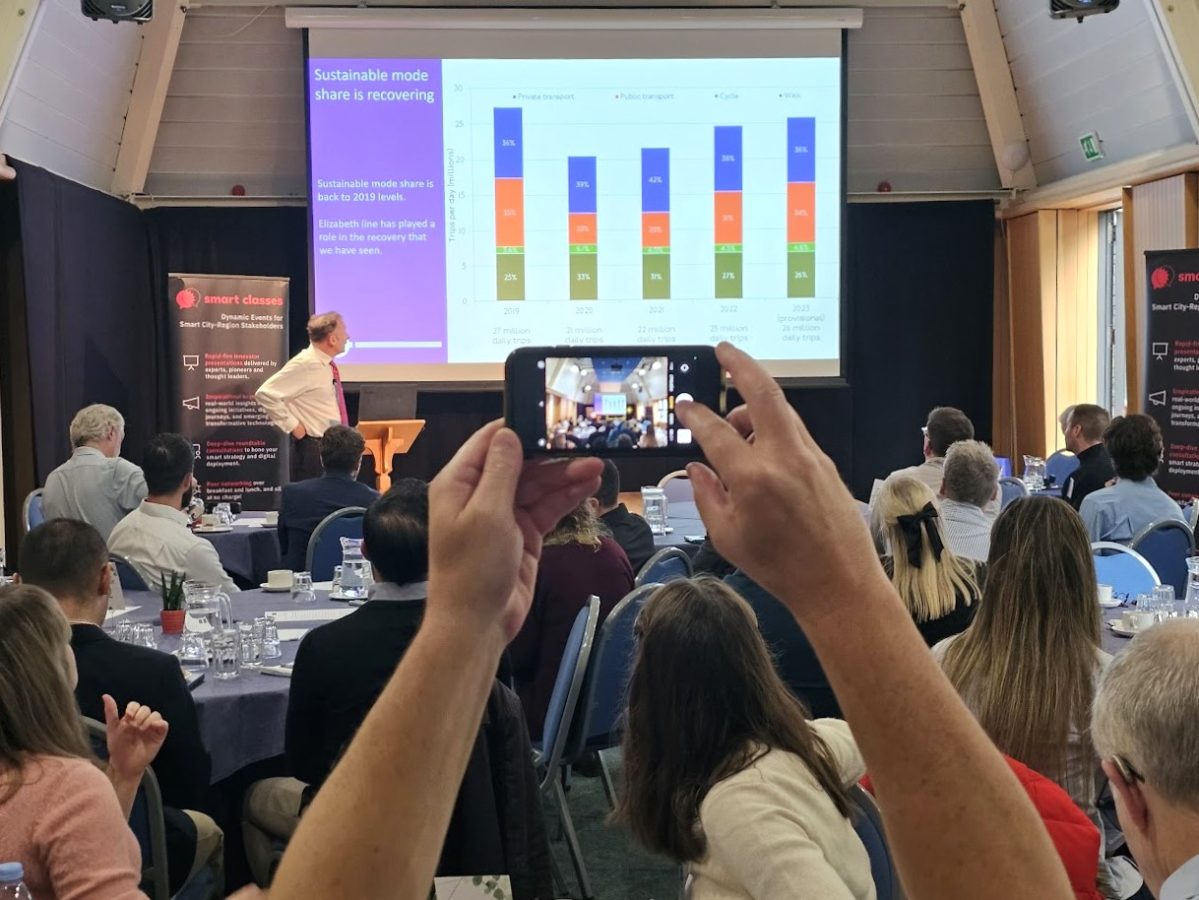
The Elizabeth line is the most significant addition to London’s transport network in a generation. In May of this year, the Mayor of London, Sadiq Khan, said:
“The Elizabeth line has been a game-changer for our city, transforming travel across London and the South East and delivering a £42bn boost to the UK economy. In just two years, more than 350 million journeys have been made and the line has directly impacted the development of 55,000 new homes and significantly supported employment growth. The Elizabeth line has played a vital role in our recovery from the pandemic and is helping to build a fairer, greener and more prosperous London for everyone.”
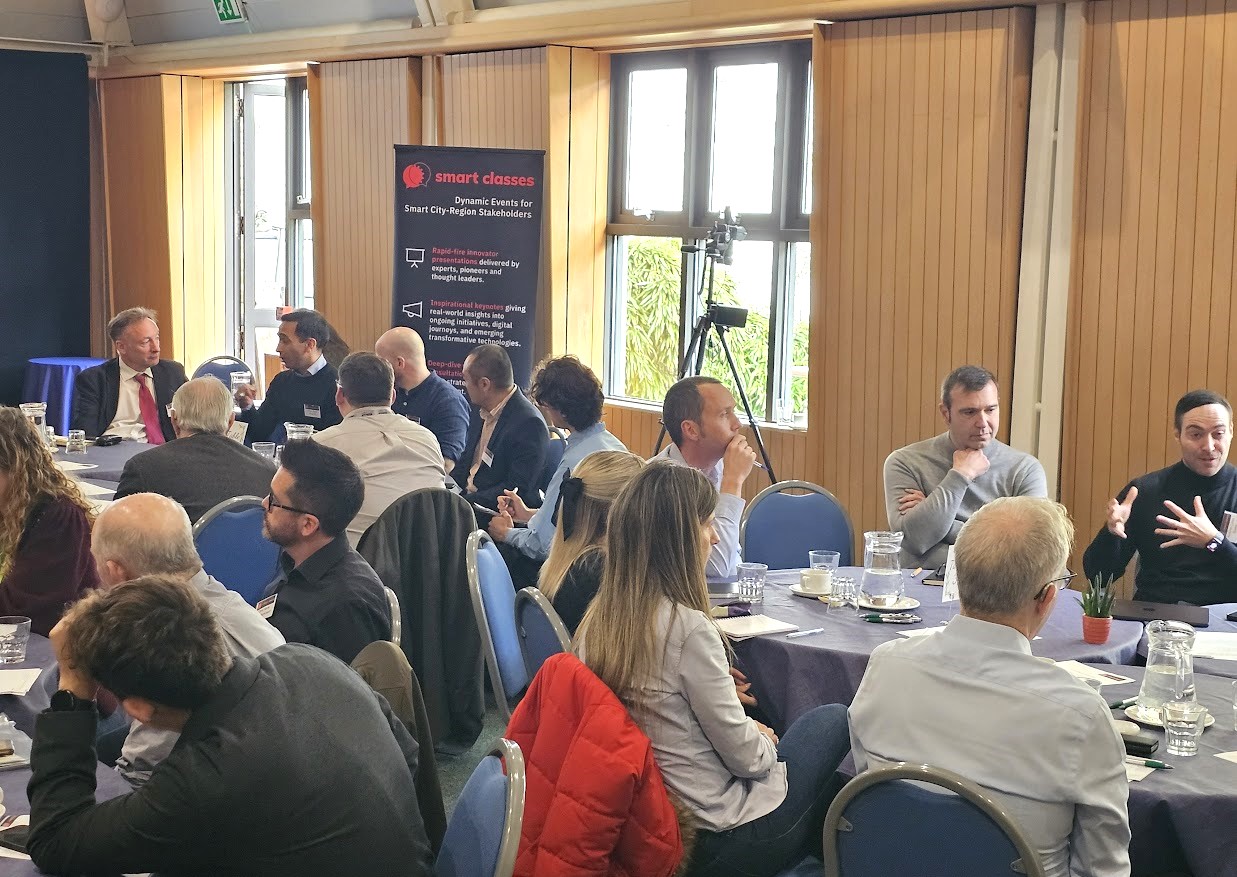
Earlier this month, at TRANSPORT Smart Class, London & South East England 2024, we welcomed Geoff Hobbs, Transport for London’s Director of Public Transport Service Planning, to enlighten us further. In a fascinating opening keynote, Geoff outlined how TfL have adjusted their various transport networks to accommodate the new line and explained how travel patterns have changed. He also discussed the impacts on journey times, mode shift and travel behaviours, population and employment.

Summary of presentation highlights:
- Adjusting the public transport network: Buses…
- TfL continuously review the bus network and its frequencies and have materially changed the bus network in the west, east and south-east;
- The primary objective of TfL’s super-sized review was to ensure capacity provided by the bus network was sufficient to meet passenger demand when the Elizabeth line opened;
- The approach has been to analyse current demand data on routs in the vicinity of the Elizabeth line and add on forecast change in demand; Consideration also given to providing new connections based upon stakeholder aspirations and likely demand generated by major new developments;
- Average length of ride on the bus network is 2.2 miles so long distance links to Crossrail have not been considered;
- What changes can be seen in bus-to-rail interchange volumes and access distance as a result of the Elizabeth Line one year after full operations – compared with pre-pandemic levels?
- Origin of bus trip involving bus-to-rail interchange – Mon-Fri 2019/20 P09 vs 2023/24 p09;
- Customers are more likely to head towards the Great Western mainline than previously, as evidenced by bus interchangers;
- The same is true in parts of Boroughs such as Marking & Dagenham, Redbridge, Greenwich and Bexley;
- Adjusting the public transport network: LU and DLR…
- In response to changing travel patterns and demand post-pandemic, TfL changed the DLR timetable markedly and also the London Underground Central, Jubilee and Bakerloo lines;
- A new DLR timetable was introduced in September 2022 with further enhancements in May 2023 which redistributed spare capacity to enable better use of the existing fleets, reduce crowding and customer wait times; Since introducing the new timetable, the DLR has consistently seen over 1.8 million trips per week and on average the busiest parts of the network have seen a 10% increase in passengers;
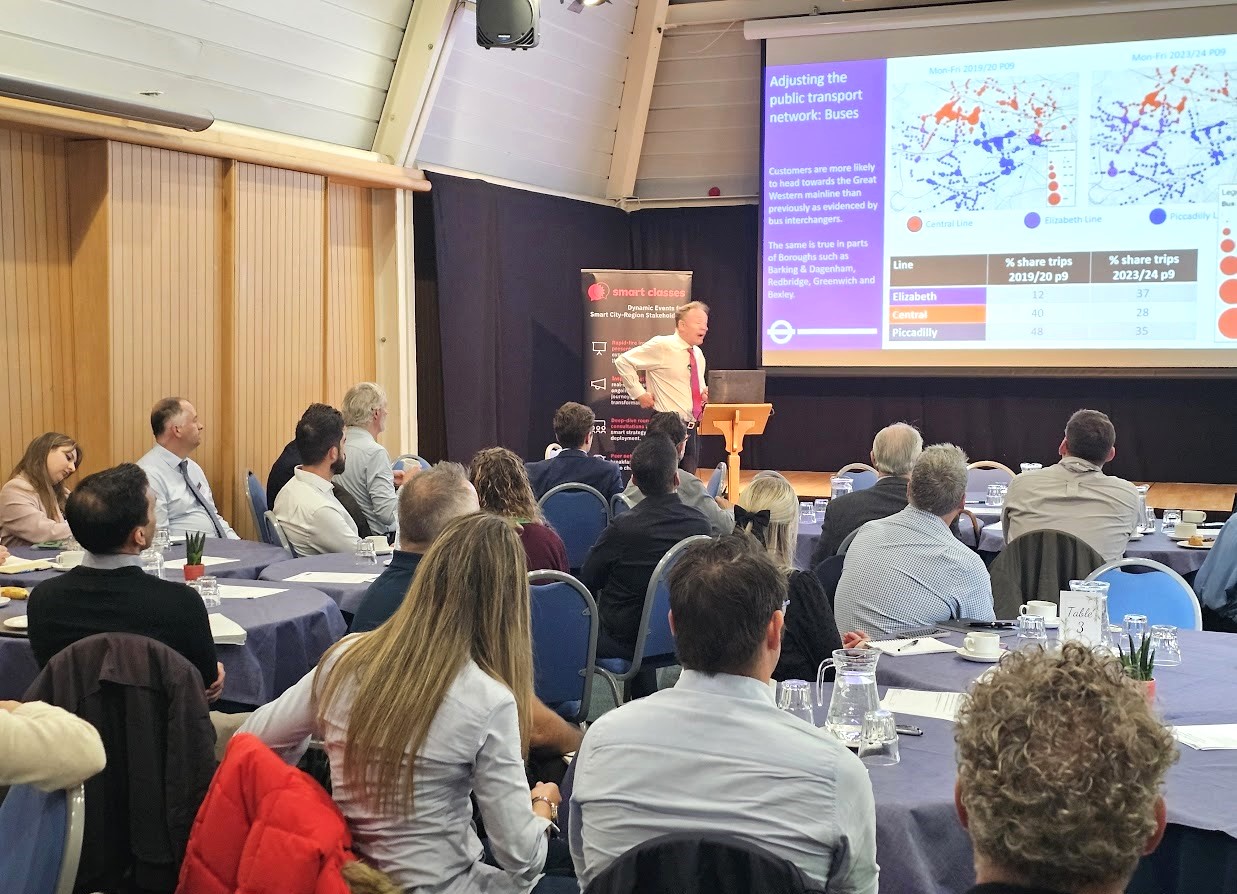
- Sustainable mode share is recovering – It is back to 2019 levels and Elizabeth line has played an important role…
- 2019 – 27 million daily trips: 36% Private Transport, 35% Public Transport, 3.6% Cycle, 25% Walking;
- 2020 – 21 million daily trips: 39% Private Transport, 22% Public Transport, 6.1% Cycle, 33% Walking;
- 2021 – 22 million daily trips: 42% Private Transport, 23% Public Transport, 4.0% Cycle, 31% Walking;
- 2022 – 25 million daily trips: 38% Private Transport, 31% Public Transport, 4.5% Cycle, 27% Walking;
- 2023 (provisional) 0- 26 million daily trips: 36% Private Transport, 34% Public Transport, 4.6% Cycle, 26% Walking;
- Generating demand: Main factors include…
- Journey time: both scheduled and reliability (or “excess journey time”) – A 10% reduction in journey time is consistent with a 6% increase in usage; Elizabeth line has reduced times for like for like journeys by 20%; Less interchange penalty and crowding as well;
- Fares – A 10% reduction in fares leads to a 3% increase in usage NB Friday off-peak fares;
- Quality of customer experience;
- New infrastructure and services such as Northern line extension, Barking Riverside extension, Superloop etc;
- Multiple economic/development factors, so influencing land-use policy makes a huge difference in the longer-run;
- High quality customer information and marketing – e.g. raising awareness of progress, change and innovation such as service enhancements and environmental benefits such as transition to zero emission bus vehicles;
- Simplicity makes communication a bit easier;
- TfL have published their latest research on the impact of journey time on usage in the Journal of Public Transportation…
- These results can be used to infer the fares impact as well, and compared to long-standing research done at intervals since the 1980s;
- It is also in accordance with other research from bodies such as Transport Focus;
- TfL’s study derived a Generalised Journey Time (GJT) elasticity for urban and metropolitan public transport networks by applying a revealed preference approach using individual passenger journey data…
- Based on more than 25 million journeys subject to 9 different service interventions (including EZL openings to the centre, east and west) within the Greater London area, they found an average GJT elasticity of -0.61. This value implies that for every 1% increase in generalised journey time, on average public transport demand is expected to reduce by 0.61%, and vice versa;
- TfL also found that the demand response to service changes is most elastic during the midday period between the peak hours and most inelastic during the AM peak and early morning;
- Another aspect of integration is how the new line has catalysed change in employment patterns…
- Between 2015 an 2022, 60% of GLA job growth has been within 1km or 15 mins walk of an Elizabeth line station;
- Liverpool Street (+185,000, +40%) and Farringdon (+89,000, +27%) have seen especially sizeable job growth post 2019, even allowing for a pandemic recovery;
- Flat sales activity from the Land Registry as an insight into how population has changed…
- Proximity to Elizabeth line has increased the amount of flat sale activity, especially new build; The story at Woolwich is most notable;
- Between 2015 and 2022, average flat prices across the GLA increased by 21%; The Abbey Wood route has seen around 40% growth, the eastern route around the London average and Southall on the western route an enormous 118% growth;
- So (even accounting for other external factors) developers and some home owners are making a lot of money from transport improvements such as Elizabeth line and the resultant population changes that are going on;
- Travel patterns have seemingly changed for good…
- Growth has resumed; It will take some years to recover to 2019 aggregate levels; Weekday peaks have noticeably slower recovery, especially Monday and Friday; This both helps and hinders TfL’s financial sustainability;
- Accelerating the generation of demand…
- Customer action plan and bus action plan aim to set out means to drive usage growth up faster;
- Elizabeth line was timely;
- Multiple other interventions cover connectivity, performance and scheduled journey times, capacity provision and customer experience;
- Multiple forms of advertising and customer information across regional and local press, emails, apps, social media, on-system, off-system and with stakeholders;
- Battling other challenges, most notably asset health;
- Simplicity for the customer is understated but also still a key challenge…
- Fares structure is already fairly simple (there’s even a flat fare of £1.75 for buses) but it could be simpler and there are still multiple tariffs for rail;
- The main ticketing channels – Oyster and CPC – make it unnecessary to have to understand the fares structure too much for most users, aided as it is by the best value promise;
- Contactless reduces barriers still more;
- Service is largely turn-up-and-go, a huge advantage to the majority who don’t like timetables or even journey planners, thus reducing a barrier to usage;
- TfL Go is another means by which TfL try to reduce service barriers to usage, and there are also third party apps which many prefer etc
If you meet our regular delegate qualification criteria but were unable to join us at Greencoat Place Conference Centre, London, for the live in-person event on October 10th, CLICK HERE and complete the short “Download form” (located at the bottom of the post) to receive a unique link enabling free access to the presentation video recordings and slides (including the film footage and slides from Geoff’s keynote).
Those qualifying to receive the rich presentation content from this event include commissioning, procurement, trialling, partnering and policy leads, senior influencers, strategic decision makers, programme managers and planners from local authorities (e.g. city, borough, metropolitan, district and county councils); public transport operators; regional transport partnerships, sub-regional transport bodies, combined authorities, integrated transport authorities and passenger transport executives; highways authorities and road operators; government and supporting national transport agencies; non-governmental organisations; fleet operators, parking operators, prime contractors etc.