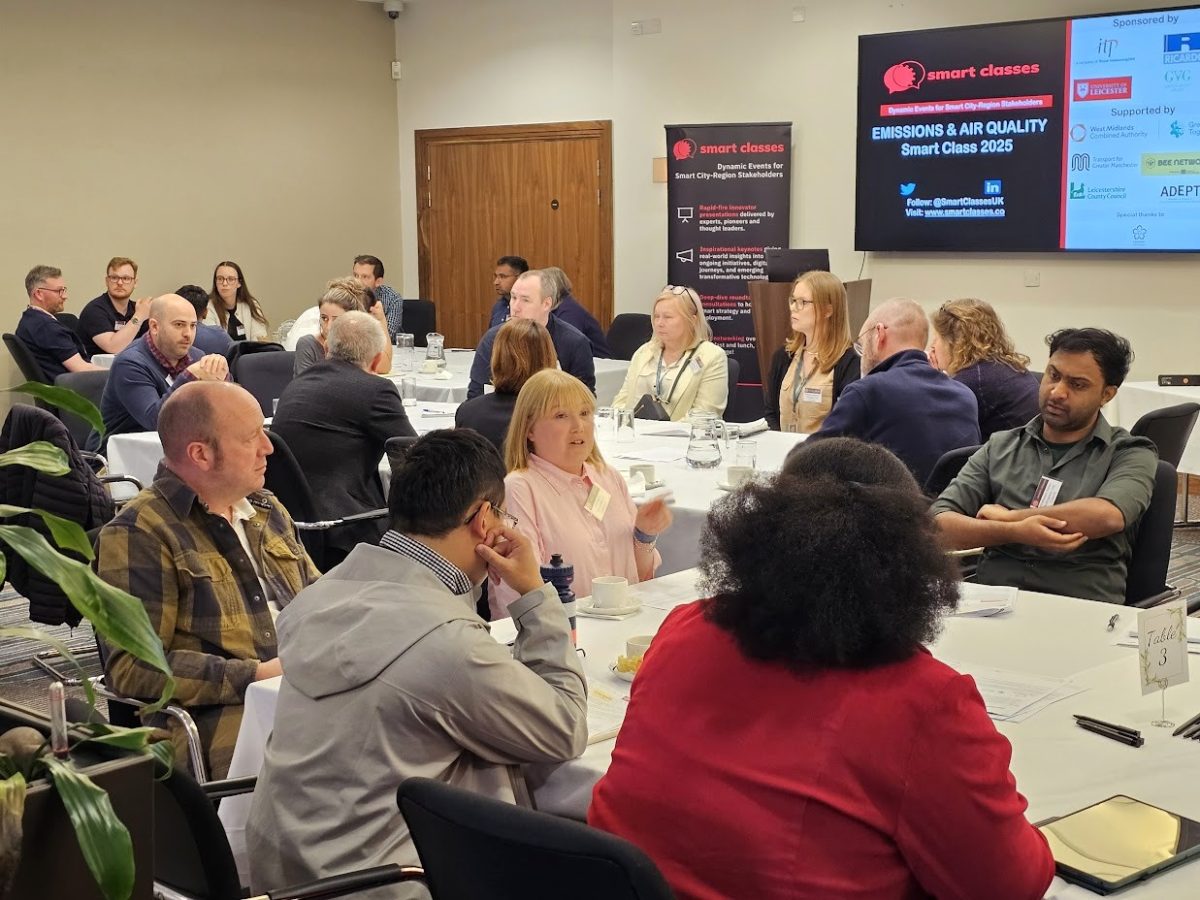
Poor air quality often coincides with the place and times where more people are likely to be exposed to it. Efforts to measure the effectiveness of interventions to reduce air pollution must account for changes in concentrations due to external factors, such as changes in weather and background pollutant concentrations.
At EMISSIONS & AIR QUALITY Smart Class 2025, Lilli Helps joined us on behalf of the University of Leicester’s Earth Observation Science (EOS) group to explain how machine learning can be applied to help achieve this:
“Models are trained on data from before the intervention begins, but for an effective model you need the right parameters to be measured and hyperparameters need tuning. Once made, these models allow us to emulate what the concentrations would have been if there was no intervention. By calculating the difference between this modelled concentration, and measurements made after the intervention, we can understand what effect it has had”.
Lilli subsequently hosted discussions with each table of delegates to share further insights from her research.
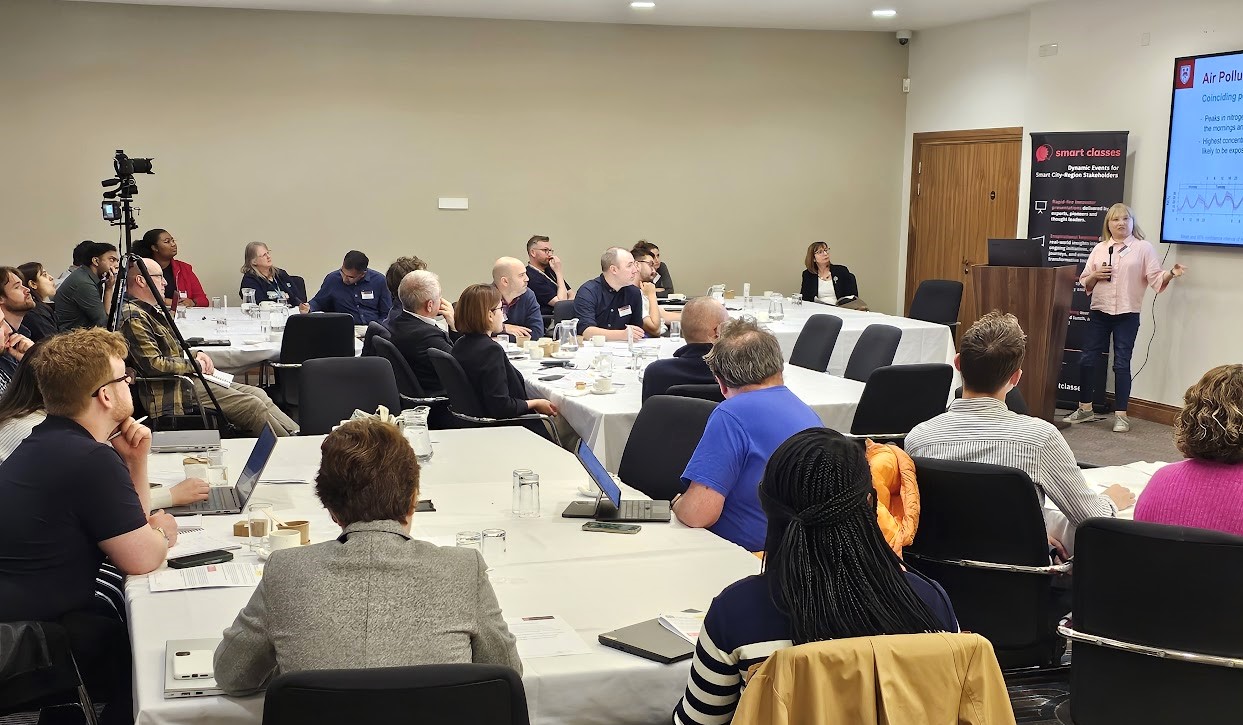
Presentation highlights and notes:
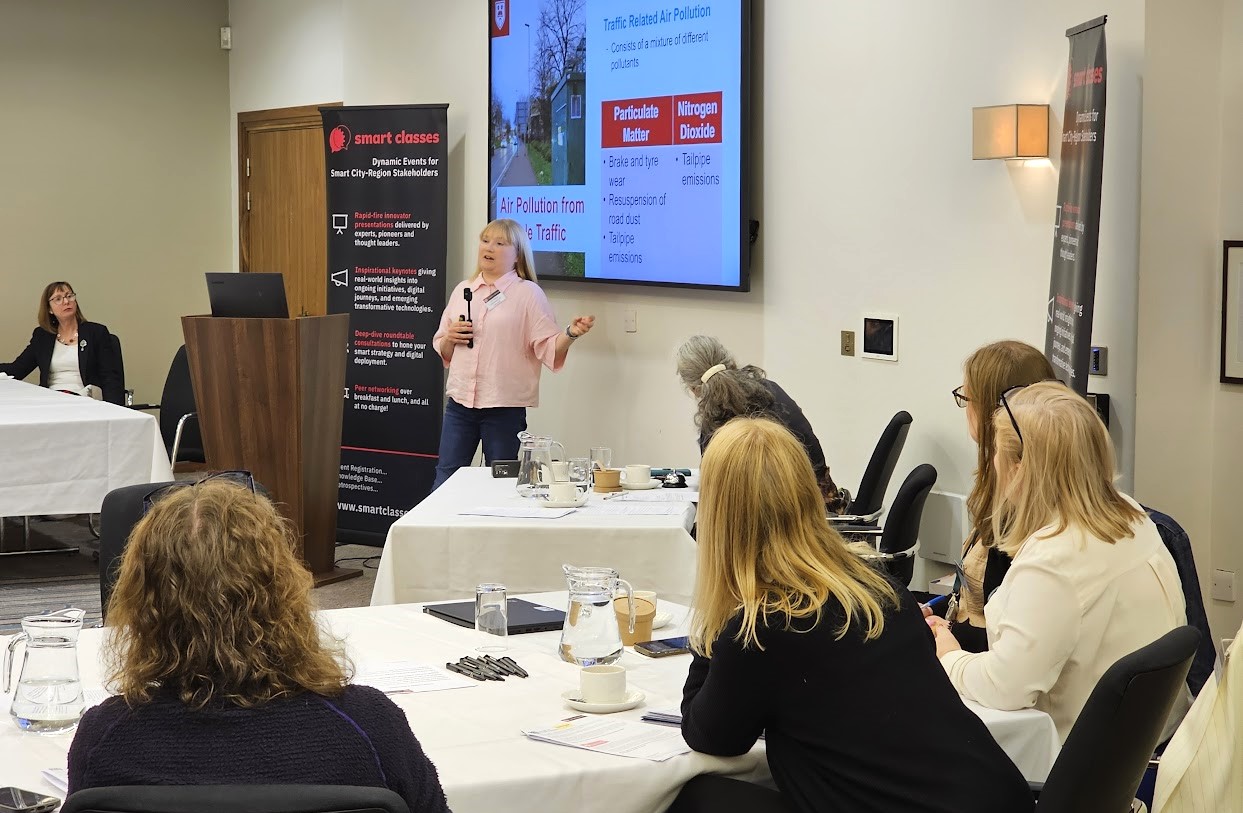
- Traffic Related Air Pollution – Consists of a mixture of different pollutants, which are measured by the Automatic Urban Rural Network (AURN): Particulate Matter – Brake and tyre wear, Resuspension of road dust, Tailpipe emissions; Nitrogen Dioxide – Tailpipe emissions;
- Air Pollution from Transport – Coinciding Peaks: Peaks in nitrogen dioxide concentrations in the mornings and evenings; Highest concentrations when people more likely to be exposed to them (Mean and 95% confidence interval of nitrogen dioxide concentrations at the Leicester University AURN in 2023);
- What we can do about it – Reduce, Extend, Protect: Reduce Emissions; Extend the distance from people and these sources; Protect the most vulnerable; School Street Closure, Rushey Mead (Leicester) + Experimental Road Closure, Buckminster Road (Leicester);
- Checking it has worked – Measuring the concentrations: Use a combination of mobile and static EarthSense Zephyr sensors; Need enough data before and after the intervention; Map showing the locations of low-cost air quality monitors around Rushey Mead;
- Checking the intervention worked – The overall process: Build the model with Measured concentrations before the intervention (Background interventions before the intervention, Temporal variables before the intervention, Meteorological variables before the intervention); Apply the model (Background interventions after the intervention, Temporal variables after the intervention, Meteorological variables after the intervention); Measured concentrations after the intervention – Modelled concentrations after the intervention = Effect of intervention;
- Checking the intervention worked – Building the model: Data and function, Initial model output value, Residuals, Learning rate x Tree outputs etc;
- Checking it has worked – Bias vs Variance: A high bias means your values are all a long way off the mean – The model doesn’t fit the data; A high variance means each time you run the model the result is different – Comes from overfitting the model; We want low bias and low variance; ‘Target diagram’ to illustrate the bias vs variance trade off;
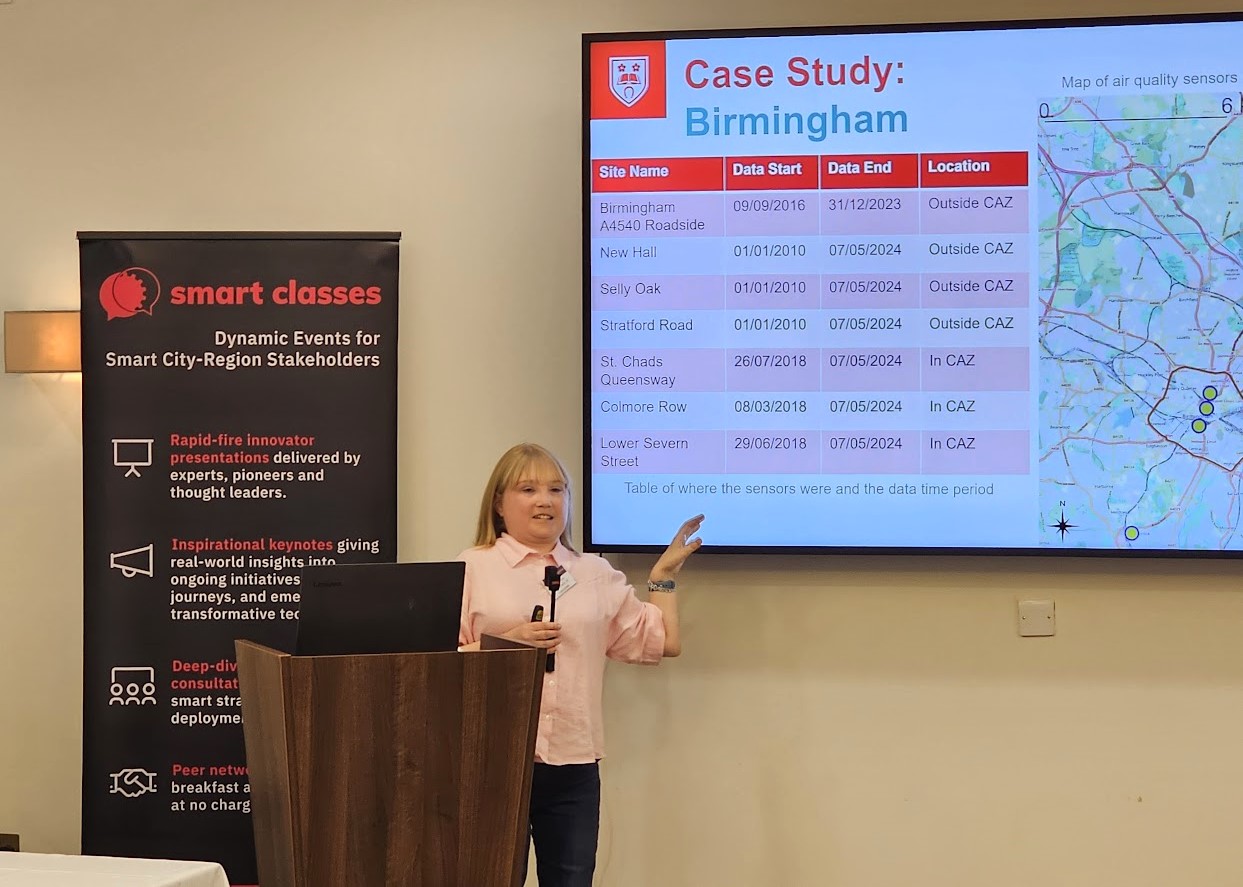
- Birmingham Case Study – Table of where the sensors were (including multiple locations outside and inside the CAZ) and the data time period; Map of air quality sensors in Birmingham used in this study;
- Ring Road Pre-COVID – building: Modelled and Measured NO2 Concentration (ugm -3) built on pre-COVID data, 2017-2020;
- Ring Road Pre-COVID – emulating: NO2 Concentration (ugm -3) Jan 2019-Oct 2022 and beyond;
- Ring Road CAZ – building: Modelled and Measured NO2 Concentration (ugm -3) built on post-CAZ data, 2021-07 – 2023-07 and beyond;
- Ring Road CAZ – emulating: NO2 Concentration (ugm -3) Jan 2019-Oct 2022 and beyond;
- Conclusions…
- Machine learning can help us account for changes in concentration that were not due to our interventions;
- Enough data, and the right data, needs collecting before the intervention happens;
- Fine tuning parameters and selecting your training data is a very important step;
- Need to be aware of the overall impact of interventions
If you meet our regular delegate qualification criteria but were unable to join us at Leicester City Hall for the live in-person event on May 8th, CLICK HERE and complete the short “Download form” (located at the bottom of the post) to receive a unique link enabling free access to the presentation video recordings and slides (including the film footage and slides from Lilli’s initial presentation).
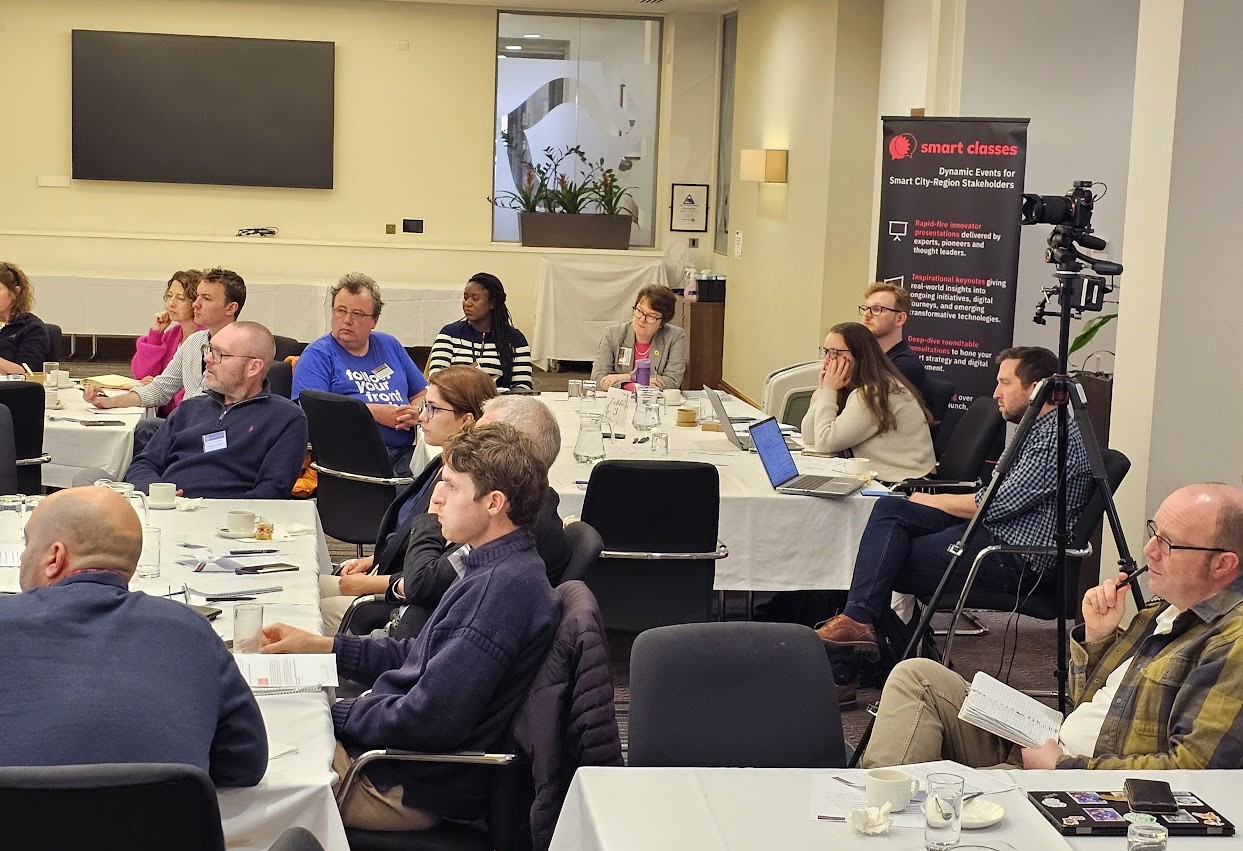
Those qualifying to receive the rich presentation content from this event include commissioning, procurement, trialling, partnering, policy and programme leads, senior influencers, strategic decision makers, environmental managers, climate/sustainability/transport/public health officers and planners from local authorities (e.g. city, borough, metropolitan, district and county councils); public and private transport operators/service providers; sub-regional transport bodies, combined authorities, integrated transport authorities and passenger transport executives; freight and logistics operators; airports and port operators; vehicle manufacturers; energy providers; potential partners from industry (e.g. retail, construction, manufacturing and waste management sectors) and healthcare; DfT, Defra, EA, BEIS, DHSC, UKHSA and other and supporting national agencies; prime contractors; academia etc.